Change profile
 This instrument gives insight into how a change process unfolds within an individual. At the same time it is an indicator of the well-being of a person at a certain point in time. For this we use the change states as defined by Don Beck and Chris Cowan in their book Spiral Dynamics. The change profile consists of:
The graph shows how a person's energy is divided across the five change states: alpha, beta, gamma, delta, new alpha and flex (as defined in Spiral Dynamics).
The vertical axis indicates the extent to which a person is in harmony with his or her life conditions; the higher the score in the top indicators (alpha and new alpha), the more a person perceives his or her life conditions as harmonious. Higher scores in the bottom indicators are a sign of friction with respect to current conditions.
The horizontal axis shows the flow of a change process. Major changes often go through this entire dynamic process, indicated by the blue lines, from harmony to friction and back to harmony.
In this example, scores in alpha and beta are higher compared to other scores, which indicates some satisfaction with the current situation (alpha), but that there is also quite a bit of friction, uncertainty or dissatisfaction. The person has no idea yet how things will change (low flex and delta) or what a possible new situation may look like (low new alpha).
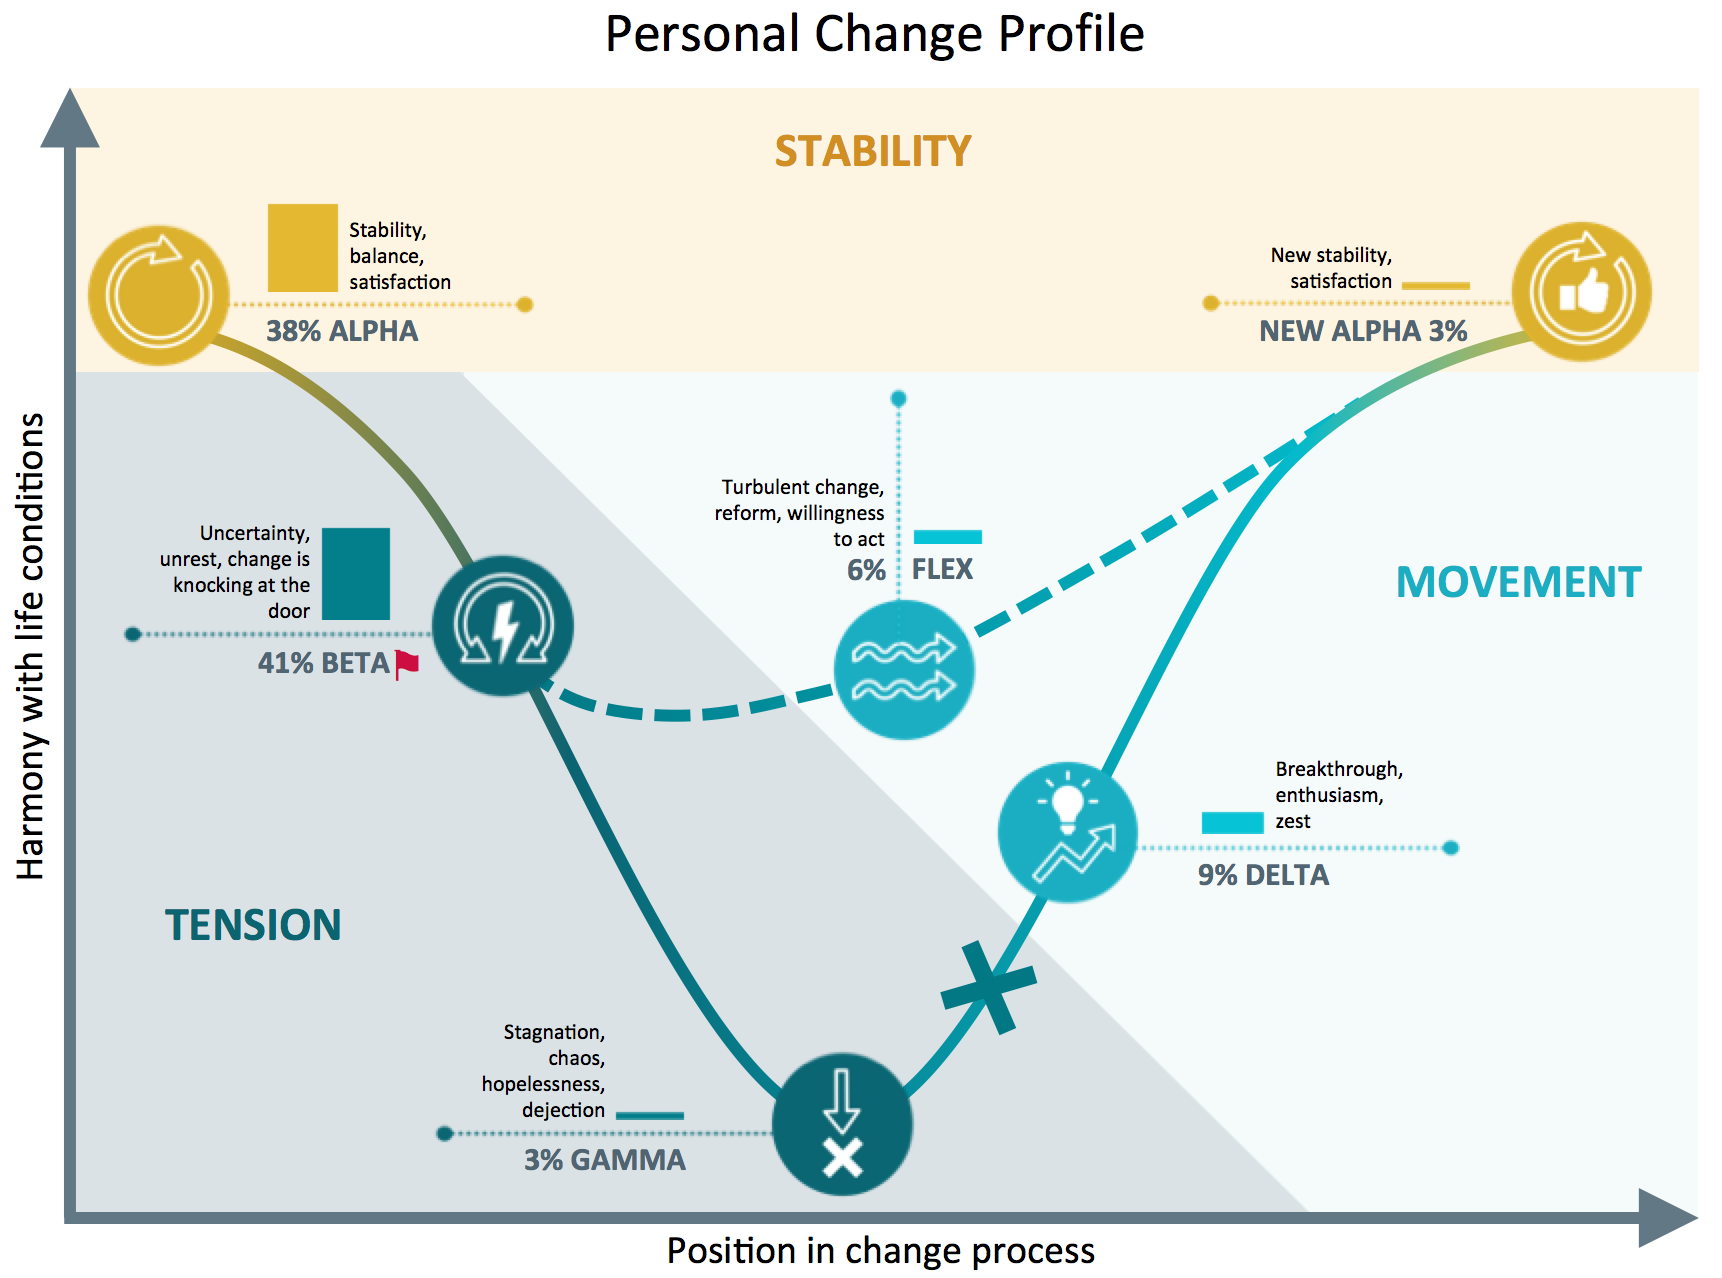
ValueMatch has grouped the change states in stability, tension and movement. This makes it easier to get an overview of what is happening. Beside that yellow or red flags indicate change states that require attention, such as the red flag with 'beta' in the example above.
Change characteristics
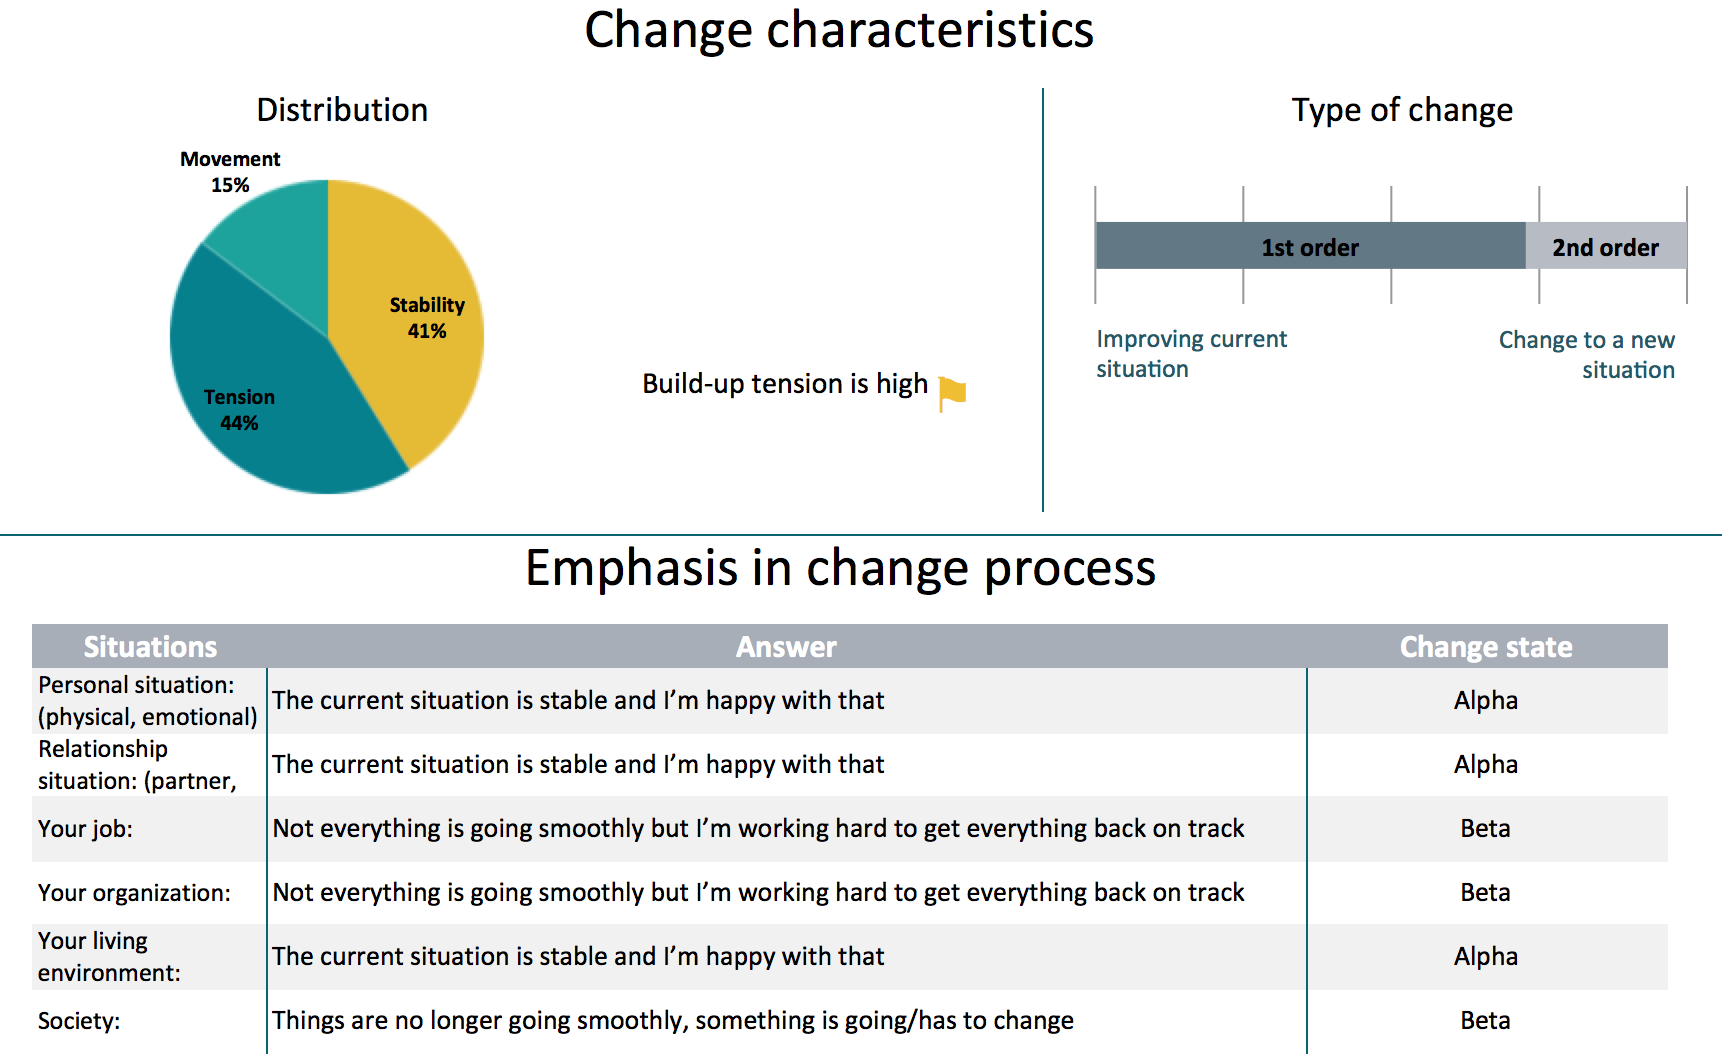
The tables for "Change Characteristics" and "Change characteristics" below are interpretations of scores shown in the table above.
The table "Type of change" shows a person's preference either to improve the current situation or to change to a wholly new situation instead. It corresponds with the First Order and Second Order change as defined in Spiral Dynamics.
The table "Emphasis in Change Process" is an indicator showing which areas of a person's life will be affected by possible change.
The interpretation of these profiles should always be performed by an experienced expert within the context of a coaching dialogue or workshop relating to change processes. ValueMatch works with a group of specialised professionals who can facilitate this. We also offer training courses for professionals who are interested in acquiring such skills.
Values Profile
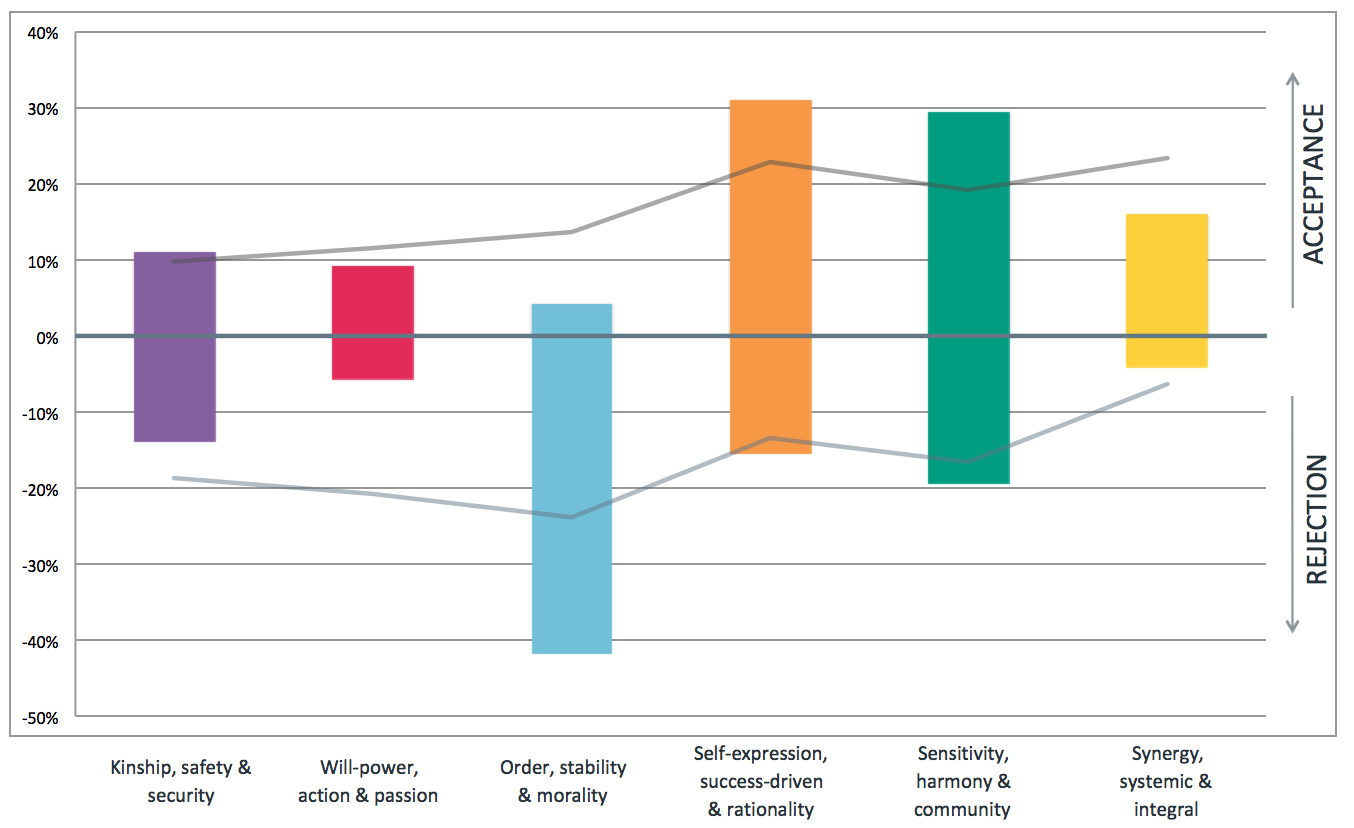
 Based on the Spiral Dynamic value systems, this tool yields deeper insight into people's values, convictions and drives that form the basis for how we think, decide and act. By means of a questionnaire, ValueMatch determines which Value Systems a person favours (accepts) or rejects. The graph below shows an example of a personal Values Profile. The upper half shows the acceptance. In this example the person most favours the orange system, which reveals a preference for self-expression, a dedication to success, and rationality. The lower half of the graph shows the rejection. In this example the person most rejects the blue system, which may indicate an aversion to bureaucracy, to moralising behaviour and to strict hierarchies. Much energy can be lost fighting such rejections.
Often profiles are created for both individuals and teams; in that case, the grey lines indicate the team averages. This directly reveals the dynamics at play between the individual and the team.
Aside from the Spiral Dynamics profiling graphs, ValueMatch incorporates the following aspects, which make it unique in the current market:
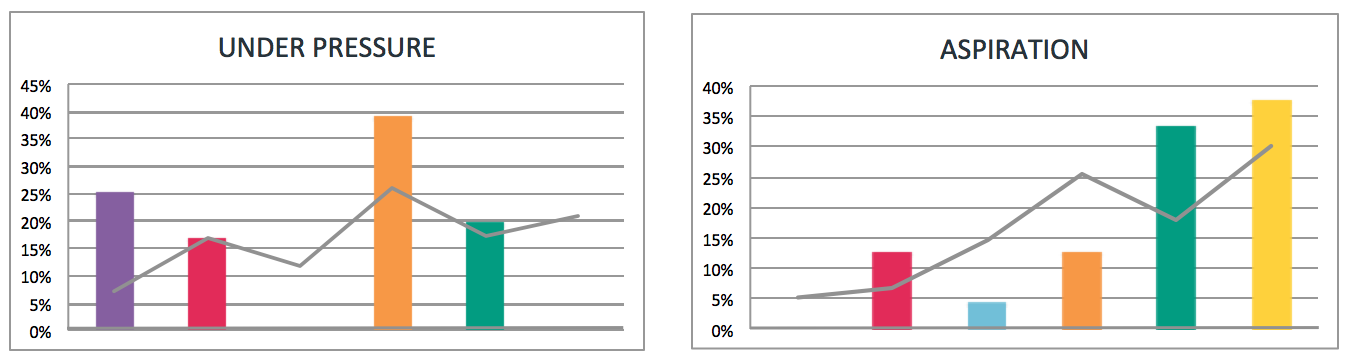
Value Systems under pressure and measuring aspiration
The research by professor Clare Graves shows that people under pressure are often driven by different values than when relaxed. For example, a manager who has a habit of seeking consensus for decision-making may under pressure become dominant and force through his own decision.
The development of new Value Systems in people generally starts at a cognitive level, before impacting their actions and behaviour. To make this visible, the ValueMatch questionnaires specifically query a person's ideal world, which reveals a person's aspiration. This aspiration either shows that they wish to explore new (or more complex) systems (green and yellow in the example below), or that they wish to integrate supporting value systems which are as yet underdeveloped.
These aspects generate a more dynamic view of a person or a team, which is a unique feature of the ValueMatch profiling tools.
Example Interpretation
In the first example graph above, we saw that the respondent's most important drives are orange (rationality, success-driven) and green (harmony and community-focused), with a strong rejection on blue (can concern different aspects such as laws, bureaucracy or dogmatic morality). The fact that the drive, when under pressure (second graph), shows a strong orange and, for aspiration, shows green and yellow (community and synergy-focused) could mean that orange is the most strongly developed and integrated system. However, the person might be happiest in an environment with clear green (community-focused) and yellow (seeing the world as a whole of interconnecting parts) qualities. This interpretation is only a possibility and needs to be validated by talking to the person and translating this to aspects of their daily life. The profiles help us formulate the right questions, but a conversation with the person is always necessary to validate our findings and to translate them into meaningful insights.
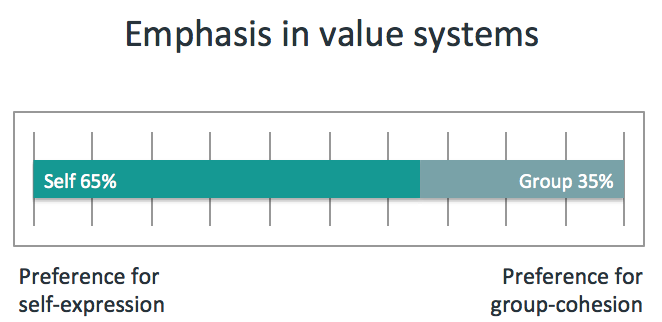
I and WE dimensions
The Value Systems can be differentiated into systems that are oriented on group-cohesion, and systems that focus more on self-expression. Often people's biography reveals a preference for one of the two, which may mean that the related Value Systems are more developed. In the example below there is a preference for the self-expression systems: red, orange and yellow.
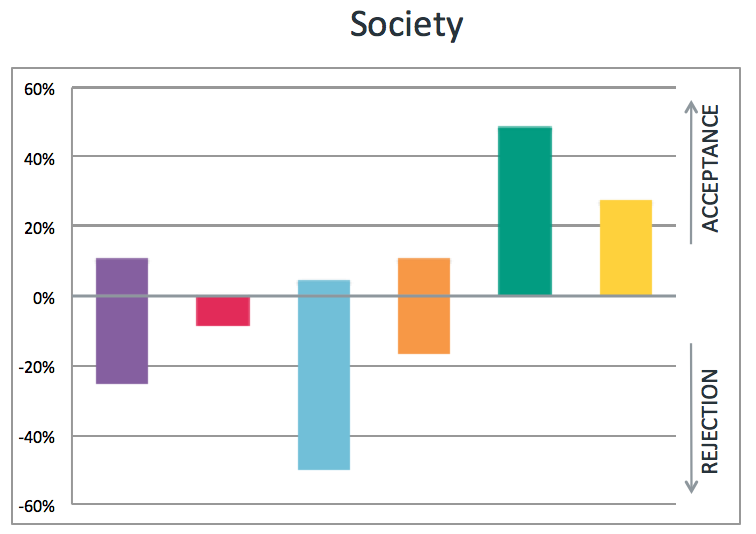
The Society graph shows how the person (or group) views society, again based on the Value Systems. This is a subset of the total Values Profile of the person (or group). This graph is relevant in situations where the organization is seen as an integral part of society and the focus of the organization is to contribute to it.
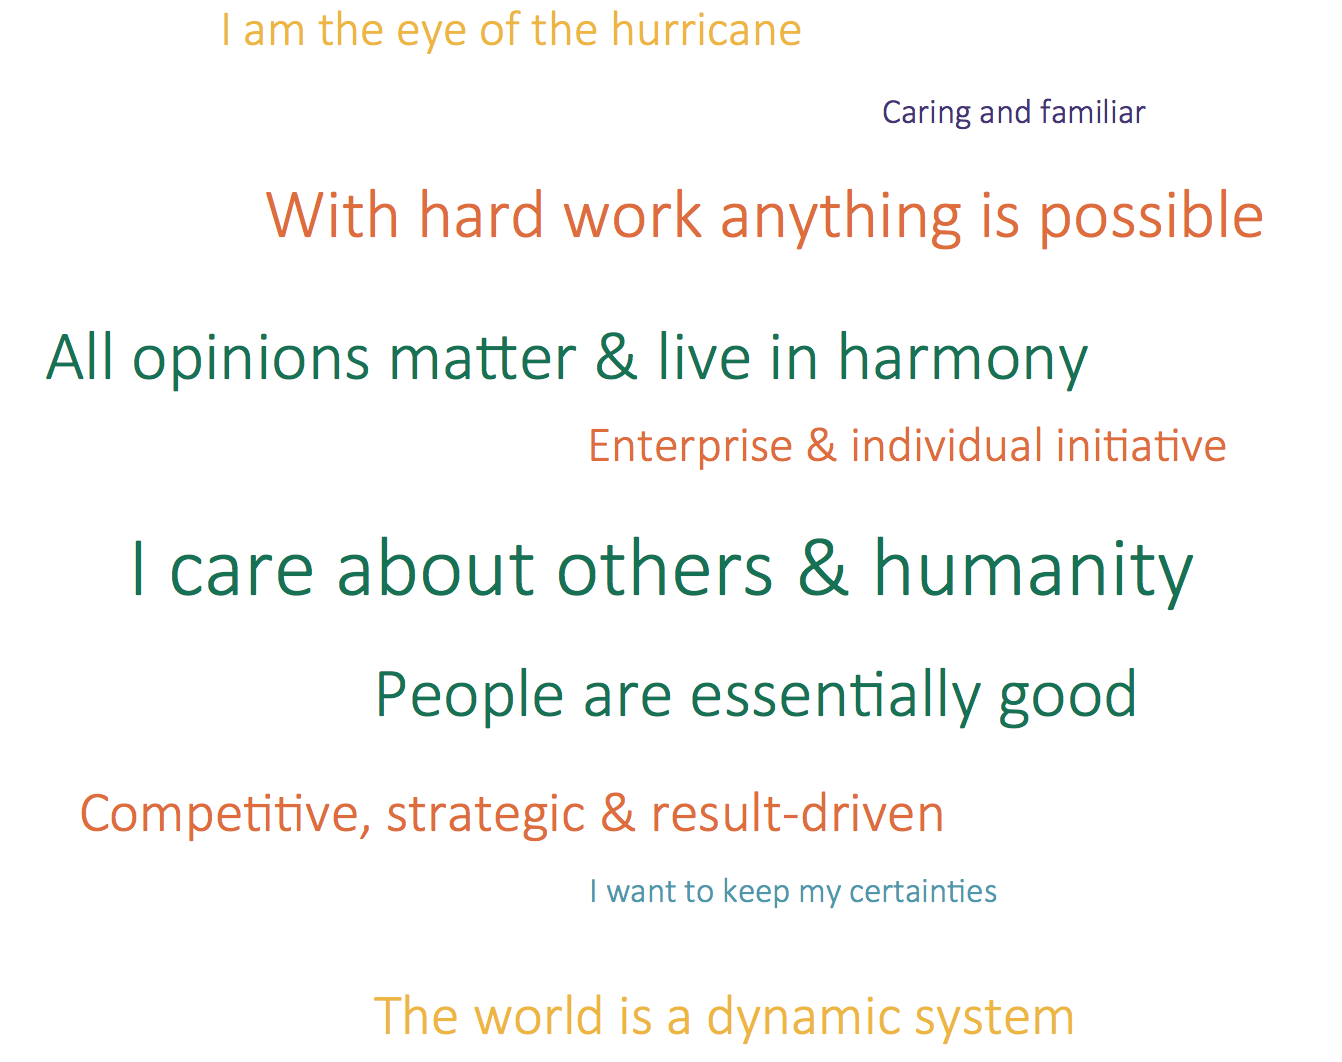
Characteristics
Finally, we provide an overview of personal characteristics (this is also created for group profiles). This is a selection of the answers with the highest scores and gives a quick overview of what is important for the person.
Group profiles with primary and secondary drives
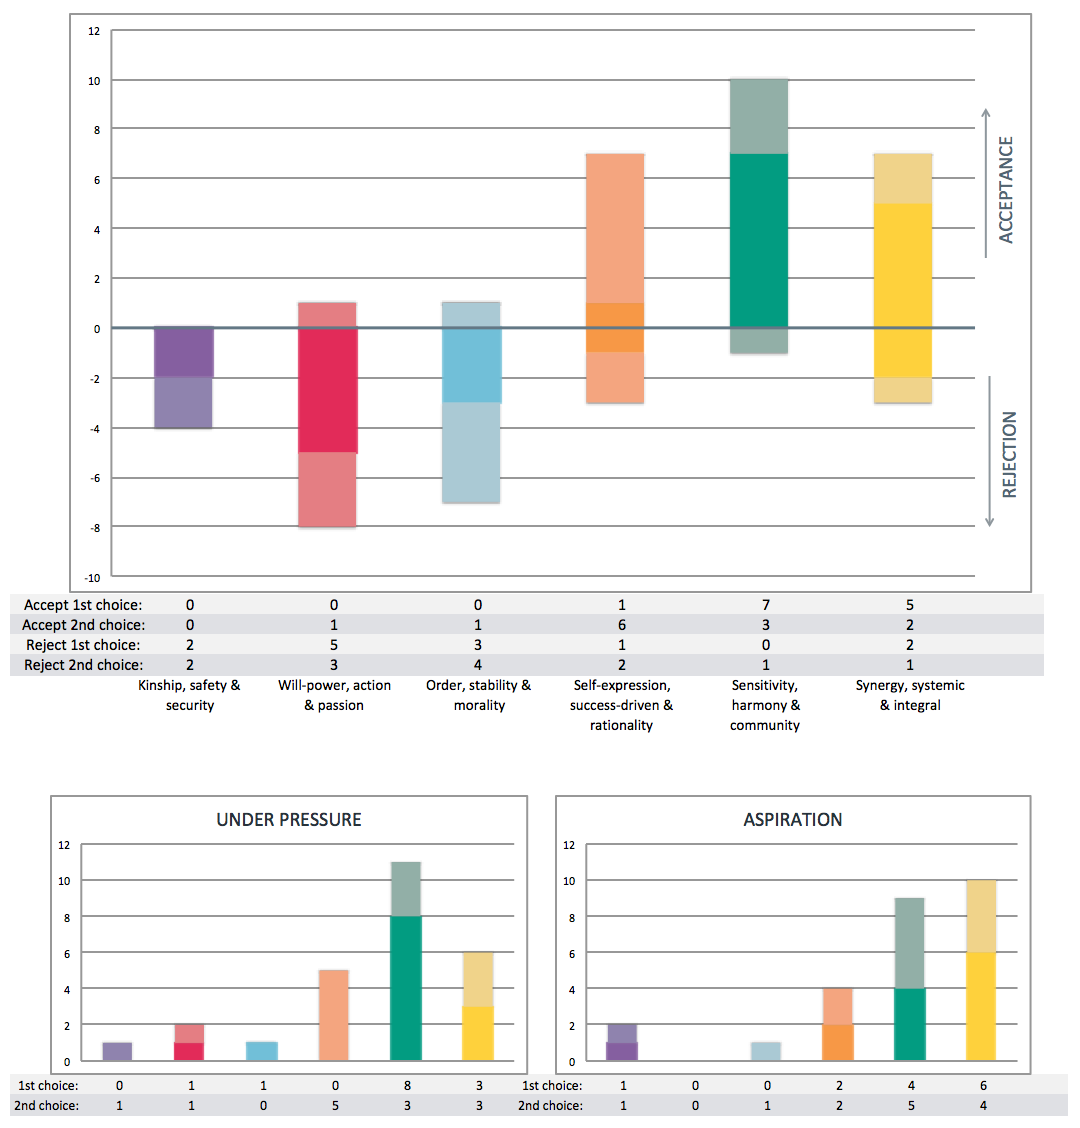
As a common application of Spiral Dynamics profiling tools, ValueMatch can create group profiles based on the average of the group members. In our research we have additionally found it useful to create an extra overview of group members' first and second choice value systems. Per respondent we therefore determine the two highest scores in acceptance and rejection. A separate graph demonstrates how many people of the group have a certain value system as first choice or second choice (acceptance or rejection). This gives a quick insight into the group's primary drive and rejections and is a powerful insight in the qualities and pitfalls of the team, its strenghts, weaknesses and the risk factors. These profiles are also created for 'under pressure' and 'aspiration'.
In the example below, the graph printed in bold presents the first-choice value systems of the group members, and the lighter parts indicate the second choice. In this example, seven of group members have green as first choice, and three have green as second choice. Three have have blue as their primairy rejection and five reject red the most. Under pressure the group relies most on their green values and yellow is the strongest aspiration of the group.